
Dashboards are often a place where impact can be had when it comes to design improvements. A dashboard done well can increase retention, utilization, and boost your NPS score, but how do you create a value-based dashboard and reap these rewards?
Here I’ll walk you through five examples of dashboards done well and explain the key lessons to take away from each, and finish off by going through a value mapping exercise to help you think about each element of your dashboard.
In this article, I'm going to talk about how to create a value-based dashboard for your users. My name's Peter Loving, I'm a product designer and consultant and I've worked with software companies for a number of years helping them make product improvements, helping them satisfy their users, and helping them to achieve their goals.
The reason I'm writing this article is that the dashboard is often one of the places where I find we can make the most impact when working with software companies that need a few design improvements.
Getting a really good value based dashboard can make a huge impact. I want to look at how and why we'd go about doing that.
Level setting: Dashboard
First of all, I want to start off by clarifying what I mean when I talk about the dashboard.
When discussing dashboard people have asked me, do you mean the analytics dashboard or something in the reporting area, or do you mean the welcome screen? It's that welcome screen that I'm talking about.
When a user first logs in, what they see there, the information they get, the updates, the welcome. Basically, it's the beginning point of their journey so that's what we'll be taking a look at in this article, and it's a very important first impression piece of the software.
Picture the scene...
Before I move on, I'd like you to imagine you're getting into your car and you're going to embark on a journey. Take a moment to consider everything you need to get there.

First of all, you need to have a destination in mind. How does this car, the dashboard, and the tools available to you help you reach that destination?
Firstly, you've got the actual tools - the steering wheel, the accelerator, and the brake, the indicators, they help you to maneuver the vehicle and actually drive.
Secondly, you've got information data. In the image below look at that map on the dashboard - that helps you to navigate, you put your destination in and you can see the route so you can navigate there too.
Thirdly, what you need is some feedback, some updates, and notifications on your journey. You might have, for instance, a road closure, or you might be running low on gas, or electricity in the case of this Tesla.
You'll need some feedback so your dashboard will alert you to things that you need to know about on your journey. With these three things, this car dashboard gives you what you need to achieve your goal which is reaching your destination.
A software dashboard can do very much the same. Before we look into why let's just consider why you'd create one.
Why create a value-based dashboard?
Sometimes I find the dashboard gets overlooked, particularly in early-stage software products. It evolves over time as the product has more features added to it.
The reason why it's good to take a step back and rethink your dashboard from the users’ perspective is that you really give them the chance to, first of all, have an incredible first impression and receive value on their very first login to your software.
After that, you increase retention, and you also increase utilization. If you're satisfying your users who have to do repetitive tasks over and over again, they can often become more frequent users of your platform because of the experience and the value that they're getting.
In turn, this helps you to develop a much better NPS score as well. Furthermore, that helps you to onboard new users and benefit from word of mouth viral marketing too.
It's a great place to invest in improving your product. That's why I often touch on the dashboard being so important. It is difficult, though.
Why it’s difficult
The fundamental reason is that you most likely have different user profiles, it's very common for software companies to have about four or five different user profiles, that all need to log in.
They all have different goals, different desired outcomes, and they need to see different information when they log in. Having one dashboard, catering to the four or five different profiles is really difficult.
An example
Imagine you've got an HR company here.
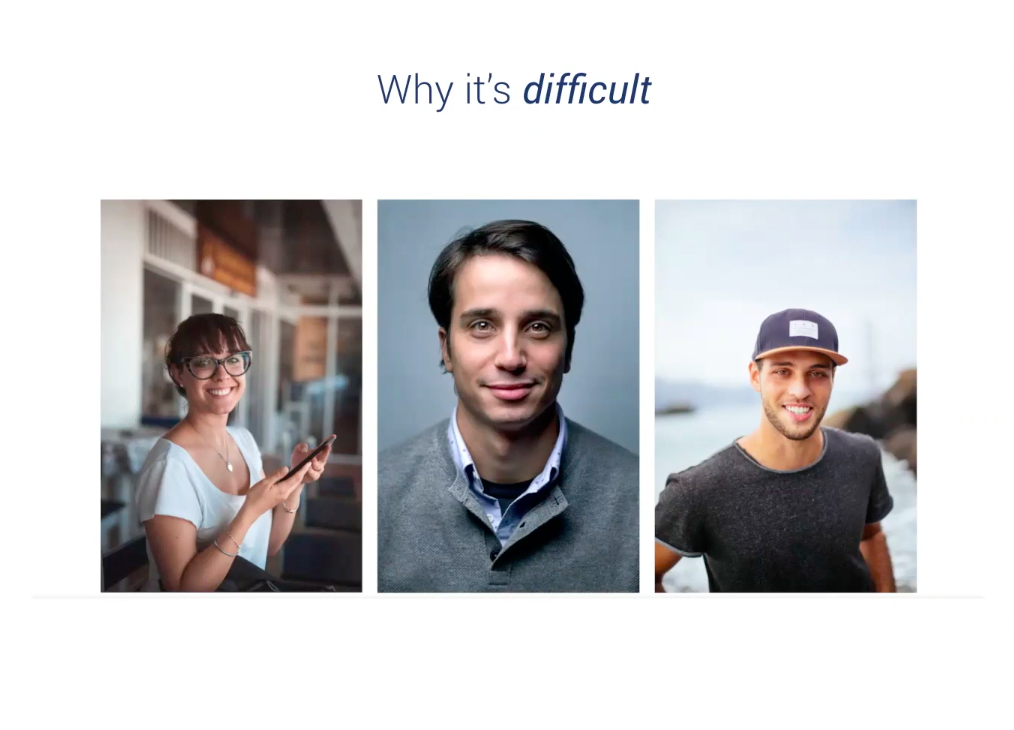
The lady on the left, imagine she's the hiring manager, you've got a CEO in the middle, and you have a candidate on the right. Imagine they're all using the same hiring platform, they're going to log in and have a very different experience.
- The HR manager monitoring applicants, taking them through the process.
- The CEO might be reviewing how that process is going in terms of logging in for a status update.
- The candidate might be logging in and seeing the candidate facing part of the software where he attends interviews and can prepare and submit video interviews as well.
That's just one example of how this can get really complicated.
Common mistakes
Here's an example of a complicated dashboard that is making some of the very common mistakes.
London Transport
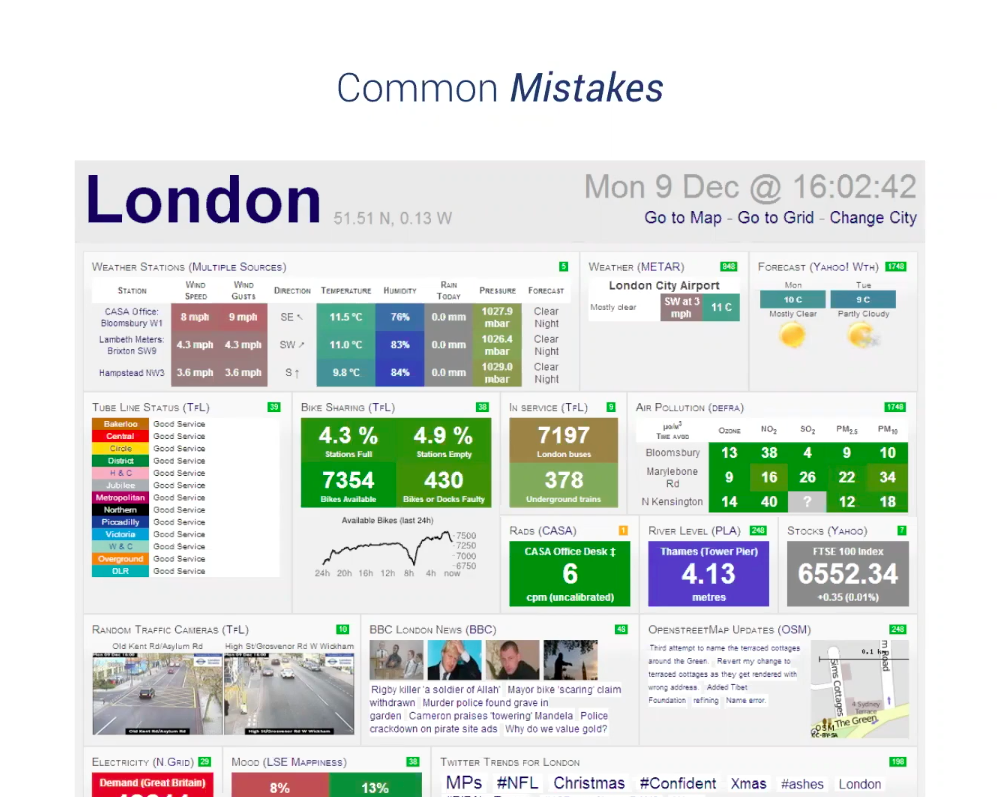
This one's actually the London Transport dashboard. This is a website called citydashboard.org. You can visit it now, it's a live dashboard, and it hasn't got the greatest UX.
The reason I've picked this out is that it's a good example of a lot of common mistakes. I see these in software companies too, plenty of SaaS companies have some of the problems that we see on this dashboard.
But what are they? I'll run through some of them before I move on.
The problems
- First of all, there's quite a lot of information here, I'd say there's information overwhelm, the way that information is presented in terms of the hierarchy is also confusing too. It's very difficult to see what is the most important information here. It's all in different sizes, too.
- Some information's tiny, some is really big - that also confuses the brain when you're trying to visually glance over this and take in information quickly.
- It's also suffering from structural instability, there's a bad layout on this page. Each of the elements has different sizes, and they're kind of fit together, cobbled together in a fashion.
- The layout design is quite poor.
- Also, we've got too many conflicting colors, font sizes, and font colors too.
There's a whole bunch of mistakes, many of them are design mistakes, but there's a thinking, an overview of the way they thought about this that's lacking. I dare say it fulfills its purpose, which is just a quick overview.
They don't have the same requirements that software does, but they've had a stab at just getting everything on the page.
Dashboards done right
Now, what I'd like to do is show you five software companies that have a really good dashboard. In each of these cases, I'm going to pick out one lesson that can be applied to your dashboard when you're thinking about how to do yours.
Holded
Let's start here with this company Holded, who are a Spanish company that has an ARP SaaS that helps SMEs manage every aspect of their business.
I've been speaking with Holded over the last couple of years, and I got to speak with one of the founders about how their dashboards were developed.
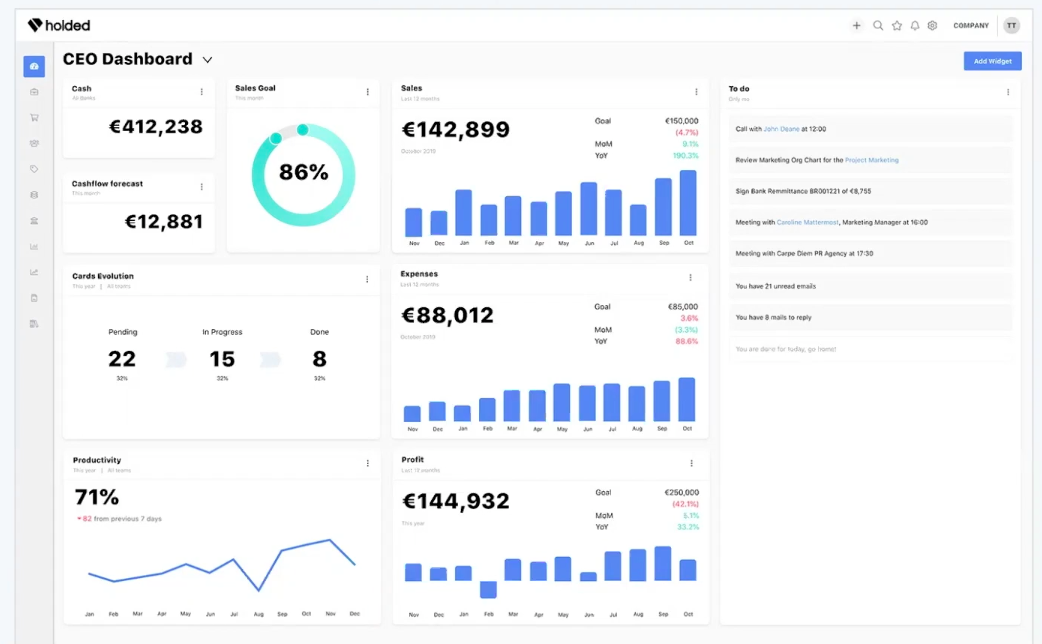
What you see here is the third iteration of their dashboards. The first two didn't quite satisfy what they felt they needed to, and users weren't utilizing the dashboard very much - that's always a telltale sign.
What happened was Holded decided to list out their user profiles, they say, "Okay, who are the groups of users that use our software that we need to think about?" In doing that, they actually came up with the job titles of these people.
That really helped them because once they started to think about the people in terms of their job titles, they could think about the goals and the information that they needed.
With Holded being a software for managing SMEs they picked out the key C-level exec users here, so they've got the CEOs and this is an example of the CEO dashboard.
They created a COO dashboard, a CFO dashboard, a CMO dashboard, and they created six. What they were able to do is to customize each dashboard to give each of these profiles or job titles within the companies that are using their software, the exact information that they need to do their day to day job successfully, using Holded.
That's a really great place to start, think about your user-profiles and think about how well your dashboard is catering to each of those groups.
Whilst we were talking about this process, Javi, one of the founders at Holded, said to me, "We're always looking for the state that best serves most users in each segment". That's a good way to think about it, you're never going to get to 100%.
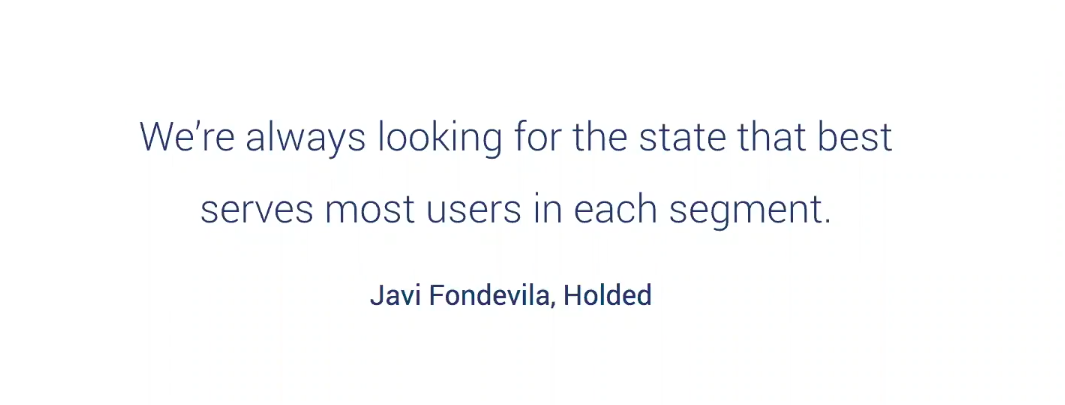
It's often evolving, and you're always making incremental improvements. But as long as you can segment your users into user profiles, you can start to really satisfy the majority of each in doing a really great job.
Lesson 1: define user profiles
Personio
The next one I'd like to take a look at is Personio, based in Munich originally and they're one of the fastest-growing software companies in Europe of the last couple of years. They've reached a Series B, to date, and they're still expanding rapidly.
When I was speaking with the head of product at Personio, he gave me a really good insight into how they developed this dashboard, which is their second iteration.
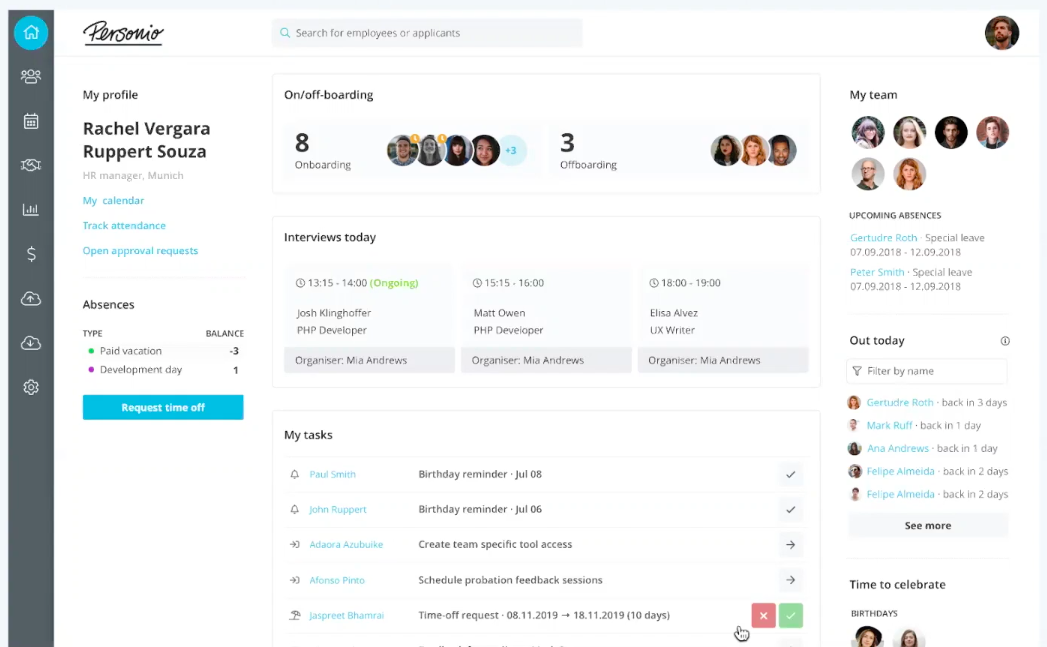
They really feel like they hit the nail on the head with this one. The key learning for them was to provide a contextual experience. Personio is a software for managing your people at companies - an HR-related software, but they like to call it people management.
They decided to interview their users and from their series of user interviews, they identified that the HR managers wanted to have relevant information on the dashboard when they logged in, which was sensitive to their current situation.
- They wanted to have a quick overview of who was in the office that day, who was off sick, who's on holiday, what kind of tasks they had coming up, any interviews or performance-related reviews with staff.
- They also wanted to see which staff were going through training.
All of this information became very contextual, it means it's always updating every time they log in, they're seeing the most relevant up to date information that they need at their fingertips.
Personio put that all together and presented this really nice, neat dashboard with a clear design that I really think is a good example of contextual experience. If you can think of places where you can do that, to enrich the experience for your users, have a thought to providing that contextual experience that they're going to value, every time that they log in.
Lesson 2: provide a contextual experience
Geckoboard
Geckoboard is another company that has done a good job on dashboards. If you're not familiar with them, they're a software that enables their users to create their own business dashboard. You could create a dashboard of anything you like, but the majority of the applications are for metrics for monitoring your business.
Geckoboard is a self-service platform so if you logged in as a new user with a new account, what you're going to see is a user journey experience, where you're guided through the process of creating your own dashboard.
Geckoboard knows only too well, that people struggle to create their dashboards the first time because often users think 'I would like a dashboard to monitor my business metrics', but the minute they log into Geckoboard, after creating an account and start that process, they suddenly are hit with the realization that they're not exactly sure which metrics they want to show and how to show them.
So, Geckoboard identified the goal of their user, the desired outcome of their user is to create the dashboard and have a handle on their business metrics. Geckoboard designed for that journey.
They lead the user through the journey of achieving that goal of creating a dashboard. They do this by a clever user journey, centered around navigation that prompts users and encourages the user through that process.
Geckoboard is a great example of goal based navigation. As you know, most of your users begin their journey on the dashboard, they log in, they see the dashboard, and from there, they continue on to perform any task that they were planning to do, any work for they needed to perform when they logged in.
The dashboard should really be a hub of providing them with the navigation that they need to achieve those goals. I had a nice chat with Ben Newell, the VP of product at Geckoboard. He says "Quantitative data shows us where the problem is and qualitative data tells us how to solve it".
As the VP of product, he and his team do lots of user research, they look at the analytics and the behavior of their users, and from that analytics, they can see where users drop off on their journey.
- Where do users typically get to, in creating a dashboard?
- Where do they stop or they struggle, or they bounce and they never finish it?
Observing that shows the VP and his team where the problems are in that journey. But the qualitative data actually tells them how to solve it. Going and speaking to the users, understanding their context, understanding why at that certain step the user struggled, and didn't finish the task.
Once they have enough insight into all of these different users and their different unique circumstances, they can then apply that to the product to make that user journey seamless in a manner that's scalable, that works for all of their users.
I thought that was a really powerful message from Ben, based on his experience, that I wanted to share in this article.
Lesson 3: provide goal based navigation
Forcemanager
Forcemanager is a CRM for sales reps. Now, if you're looking to manage a team of outbound field-based salespeople, then you will want to manage their metrics, their targets quite closely, monitor that activity. Force manager knows how important targets are in sales and they've done a very clever thing on their dashboard.
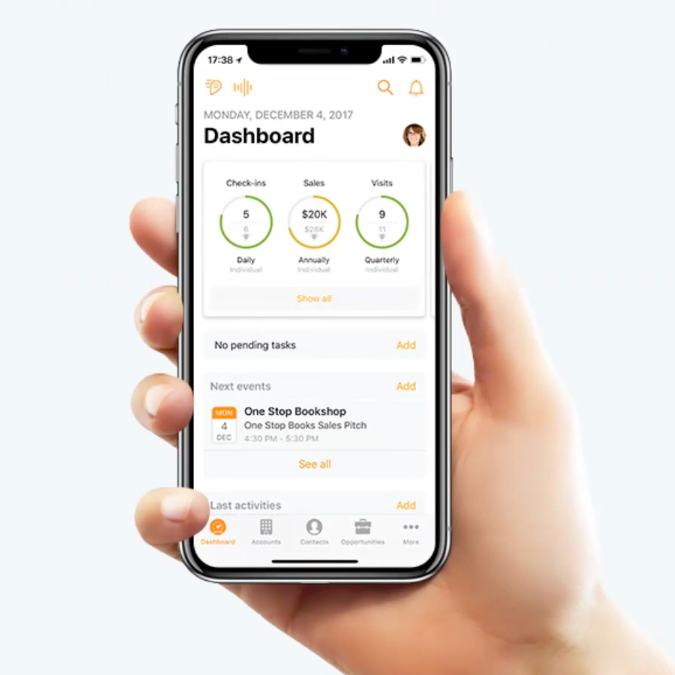
This is the mobile version you can see, but they have a desktop application too. What they've done is to enable the user to configure the dashboard with whichever metrics they need.
Their key targets, their KPIs are sitting here right on the dashboard. Every time the sales rep logs in, they see their progress against their targets for the current month, or the current week, or whatever the time period is.
From there, all their activity that they do within the platform relates to moving these KPIs in order to hit targets. It's very goal-based, it supports the desired outcome of the user, the dashboard is the information and the reference point for everything relating to the desired outcome of the user.
Sales tools are a great example of this because they have such clear targets but every SaaS product has users with desired outcomes. If you get really clear on the outcomes that your users are looking for, you can really gear up your dashboard to make it as easy as possible for them to achieve that.
That's a really nice example.
Lesson 4: show metrics that support DOs
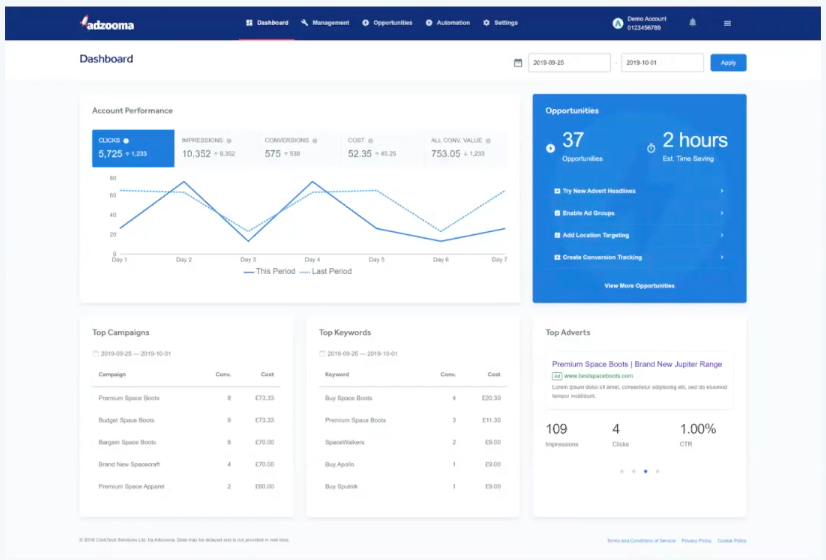
Adzooma
The last one I'd like to share here is from a company called Adzooma. Adzooma did something I really like on this dashboard, they show the users the ROI of using their product on the dashboard every time they log in.
Adzooma is a tool for managing paid advertising. You connect up your paid ad platforms with Adzooma and it helps you optimize and increase efficiency in your advertising. You can see the metrics and you can see where there are issues and where there's success, but the blue widget on the right-hand side of this dashboard is the key area that has a lot of power.

What it does is it shows the user all of the work that Adzooma is doing to improve their results. You can see it says 37 opportunities all created by Adzoomer based on their ads, and then also time-saving of two hours.
Because Adzooma has gone in and increased efficiencies on managing their ads the user can start acquainting their investment in the Adzooma platform to direct results that it has on the business in terms of time and money, actual revenue.
The opportunities will lead to sales that they can start to quantify the revenue, and the timing - they can also quantify how much time they've saved and the revenue that gives them. For people that get a lot of value from Adzooma it's an absolute no-brainer to pay for this tool and for this service.
It's easy for users to forget so it's quite nice that they have this reminder and they also get the snippets of insights of exactly what it's doing for them. I really like that feature.
David Sharpe, one of the founders at Adzooma put it to me this way when he was explaining this process of how they developed that dashboard, he said, "We needed to quantify time and money saved in order for our users to understand the value we were adding". Isn't that great? Because often, you are very aware of the value you're adding, but often the prospect or your customer might not see all of that behind the scenes value.
This is a nice way for Adzooma to show that. If they needed to quantify it for the user to understand and appreciate them, then that's what needs to be done and has been done in quite an elegant way I think.
Lesson 5: reinforce ROI
Summary of five principles
Now I want to summarise the five principles from the dashboards that I've shared with you.
I’d do that by saying help users achieve their goals by providing the framework to succeed.
Your software is a tool that they use to perform work but think of your tool as providing a framework that leads the user through to their desired result or desired outcome.
That's a really nice way to think about it because when you start building a framework into your product, that means there's a system in there and that systems been thought out very clearly to make sure that your user does succeed with your product.
Obviously, that's going to increase utilization, retention, give you a better NPS, and improve your ability to market your product. Not only that, but once you have a really well-designed dashboard, it's very easy to share that as a graphic, as a sales tool for prospects to visualize using your platform.
Value mapping exercise
I developed a framework, if you're thinking about making improvements to your dashboard, I have a framework here called the value mapping exercise that I created to help you think about each element that's worth considering in order to design a really powerful dashboard.
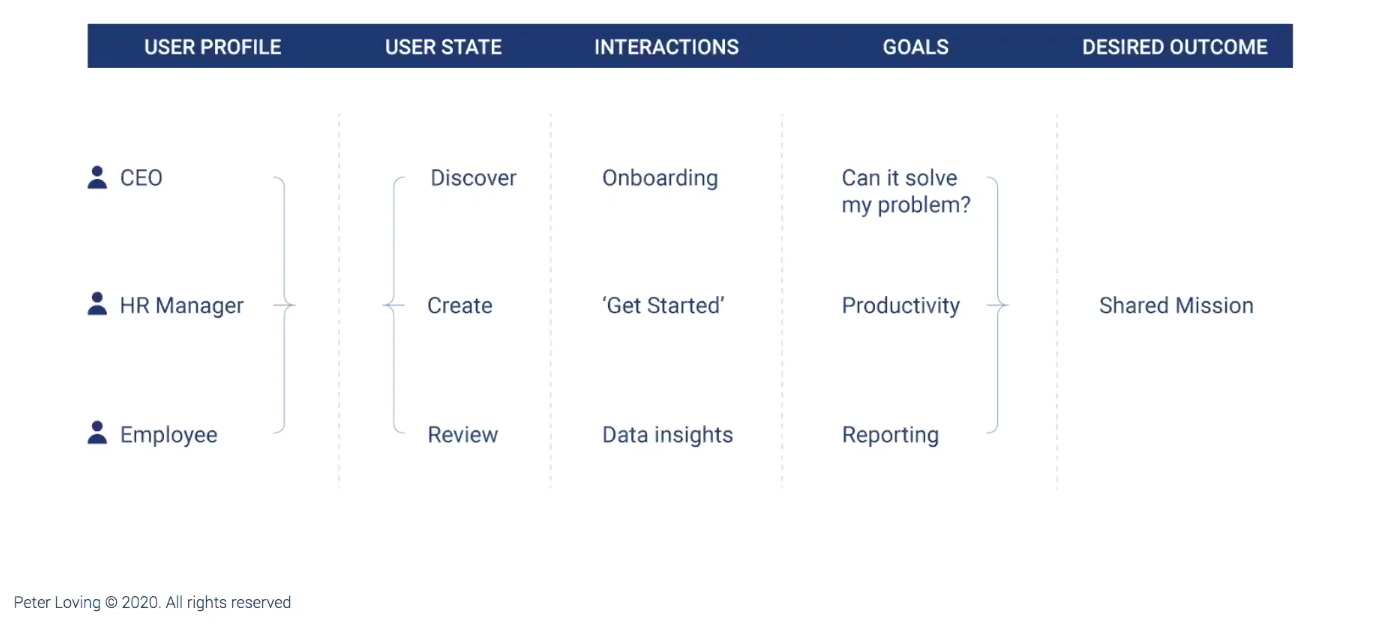
User profile
On the left-hand side, you would start there and list out your user profiles. Think of all the different profiles you have.
Desired outcome
On the far right-hand side, you've got the desired outcomes. Now they might be the same, but they might be different for each person. You want to list those out.
User state
In between that you've got the different states each user is in when they log in. There are usually three states that users are in when they log into a platform.
- They're either looking to discover the product itself or discover something about the product.
- They're either going in to create, to perform tasks, to do actual work.
- Or they're in this third state, which is a kind of review state, they might be looking for progress updates, looking for information, or looking to gain a report or share a report.
Goals
That leads us to the goals. So the fourth column, the penultimate one on the right, the column for goals, thinking about your user based on what state they're in. You want to think about the goal of their session for that state that they're in.
How does that goal lead to the overall desired outcome?
Interactions
In the middle, we've got interactions. This column really is where you list out the physical interactions that this user needs to go through in order to reach that goal that ultimately works towards the desired outcome.
That's the brain mapping exercise to increase value and hopefully, that can help you when you're thinking about yours.
Thank you.